(CLICK ON PICS TO ENLARGE)
As I was killing a little time before going to the doc's office for one more cortisone shot in my right knee this afternoon, I began playing around with my Level 2 home-based radar imagery...and I found a good 'un!
(all images from KFFC radar out of the Atlanta area)
This first map is purely for reference and grabbed from the Level 3 data map AFTER the below grabs were taken. The funnel would have been south and a little west of the current position in the purple tornado warning box, fyi. Atlanta is to the north.
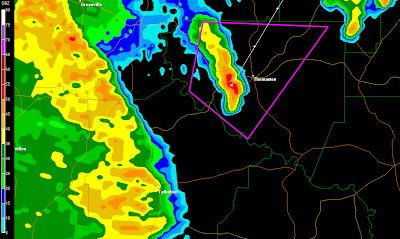
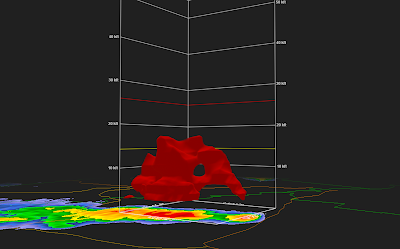
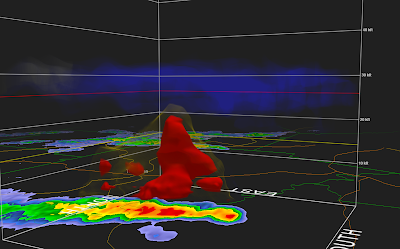
 12:32 pm...on isoscan for severe (red) weather from warning area. Note funnel growing to the right on the tail end of the storm (very typical)...
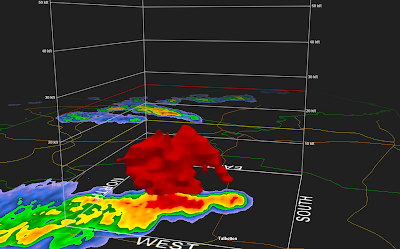
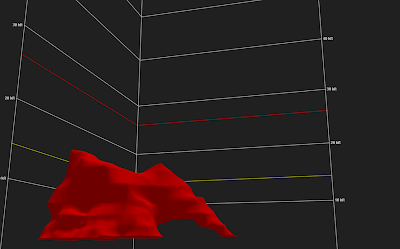
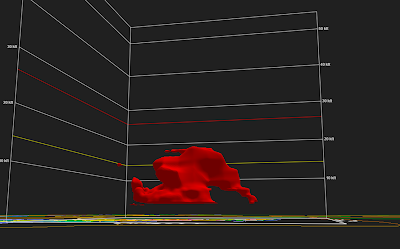
 Rotated box to the east, looking west and from close to eye-level with the storm...still the 12:32p scan...
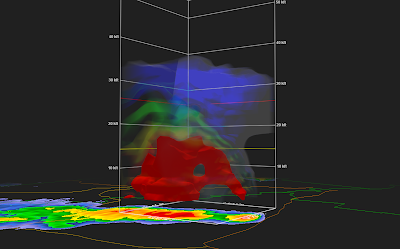
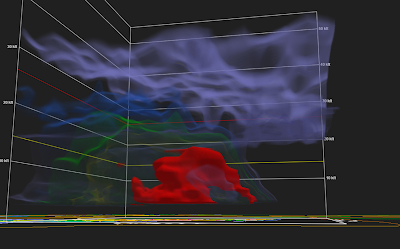
 Rotated view to the SE looking NW, adding ghosts of other intensity layers...storm tilt to the ENE is rather evident (upper prevailing winds)...
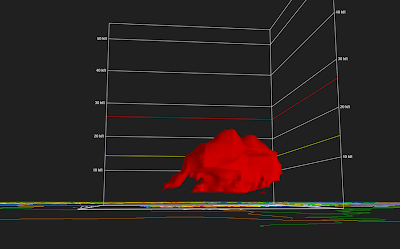
 Intensification of funnel and storm formation, now at 12:36p...
 Same time, 12:36p, but added 'lit volume' showing higher storm levels...
 12:41p scan at eye level...strong feed to funnel (right)...
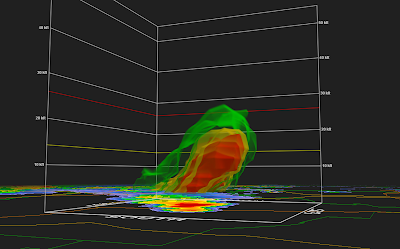
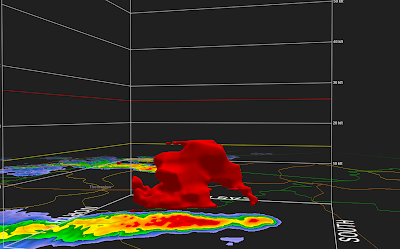 Storm intensification at 12:45p...
 ...with 'lit volume' added...just cool to look at!...
 12:45p eye-level scan for the fun of it...
 12:50p and the funnel feed to the surface had apparently ceased...for the time being....
Time to go to doc for some relief....ciaou!
(all images from KFFC radar out of the Atlanta area)
This first map is purely for reference and grabbed from the Level 3 data map AFTER the below grabs were taken. The funnel would have been south and a little west of the current position in the purple tornado warning box, fyi. Atlanta is to the north.

 12:32 pm...on isoscan for severe (red) weather from warning area. Note funnel growing to the right on the tail end of the storm (very typical)...
 Rotated box to the east, looking west and from close to eye-level with the storm...still the 12:32p scan...
 Rotated view to the SE looking NW, adding ghosts of other intensity layers...storm tilt to the ENE is rather evident (upper prevailing winds)...
 Intensification of funnel and storm formation, now at 12:36p...
 Same time, 12:36p, but added 'lit volume' showing higher storm levels...
 12:41p scan at eye level...strong feed to funnel (right)...
 Storm intensification at 12:45p...
 ...with 'lit volume' added...just cool to look at!...
 12:45p eye-level scan for the fun of it...
 12:50p and the funnel feed to the surface had apparently ceased...for the time being....
Time to go to doc for some relief....ciaou!
4 comments:
How do you do that whole thing with the storm?
It's Gibson Ridge software that interpolates data from National Weather Service radar sites in the U.S. Purchases for 2-D Level 3 data and 3-D Level 2 data are separate; easily searchable on-line, and reasonable, given what they do (3-D Level 2 program is a bit more $). From there, you need to understand what it does and how it does it to make the images! And I'm still learning a GREAT deal!
I downloaded that but how do you peel back the layers?
With the level 2 analyst, once you are set up to receive Level 2 data, you find a good storm and use the volumizer button on the top to put a box around it...opens to a new window, which you can then rotate the storm with all your mouse controls. Select isosurfaces on the right, then click on the volume alpha button on the top (right)...that sliding bar lets you pick the dbz threshold/color you wish to look at. The 'lit volume' button lets you use the same volume alpha scale and at your discretion light the different levels to a different opacity to get the ghosting effect. The Level 2 Analyst takes a lot of playing with to get the most out of it (there are help forums worth looking at for grlevel'stuff', I think. The Level 3 is only 2-D, so no volume scans there...but even the Level 3 is highly useful.
bob
Post a Comment